- Moving Averages (SMA, EMA, WMA)
- MACD (Moving Average Convergence Divergence)
- Parabolic SAR (Stop and Reverse)
- ADX (Average Directional Index)
Indicators for Day Trading And How to Use Them

Day trading is all about making quick decisions based on short-term price movements. To make informed decisions and improve profitability, traders use technical indicators—mathematical calculations that help identify trends, entry and exit points, and overall market behavior.
Technical indicators are mathematical tools used by traders to analyze price data, volume, and other market factors. These indicators help traders spot trends, predict price movements, and time entries and exits.
For day trading, indicators are essential for identifying potential opportunities within a single trading session. The key to success is knowing which indicators work best under various market conditions and trading styles.
| Indicator Type | Function | Best Used For |
|---|---|---|
| Trend | Identifies market direction | Trending markets |
| Momentum | Measures price change speed | Entry/exit timing |
| Volume | Tracks trading activity | Confirming trends |
| Volatility | Measures price fluctuations | Setting stop-loss levels |
Trend indicators are the backbone of any trading strategy, as they help determine whether to take a long or short position. Key trend indicators include:
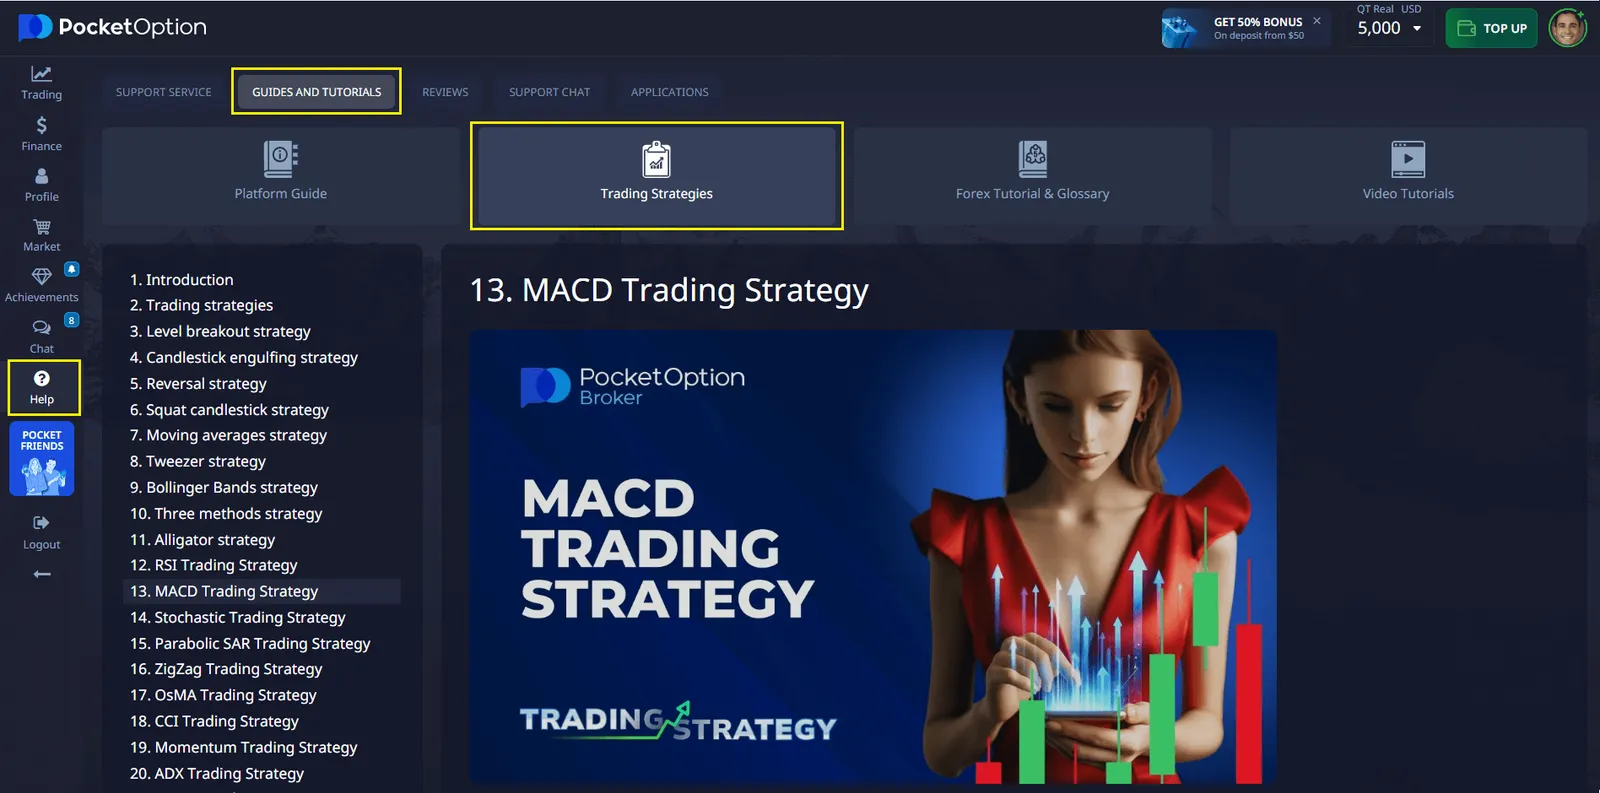
For example, the 50-day and 200-day moving averages are commonly used to identify market trends. When the 50-day crosses above the 200-day (golden cross), it typically signals a bullish market. On the other hand, when the 50-day crosses below the 200-day (death cross), it suggests a bearish trend.
| Moving Average Type | Calculation Method | Response to Price Changes |
|---|---|---|
| Simple (SMA) | Average of prices over a period | Slower, smoother |
| Exponential (EMA) | Weighted towards recent prices | Faster, more responsive |
| Weighted (WMA) | Linear weighting by recency | Moderate speed |
Momentum indicators measure the speed of price changes, helping traders pinpoint potential reversal points. These indicators are essential for precise entry and exit timing in day trading.
- RSI (Relative Strength Index)
- Stochastic Oscillator
- CCI (Commodity Channel Index)
- Williams %R
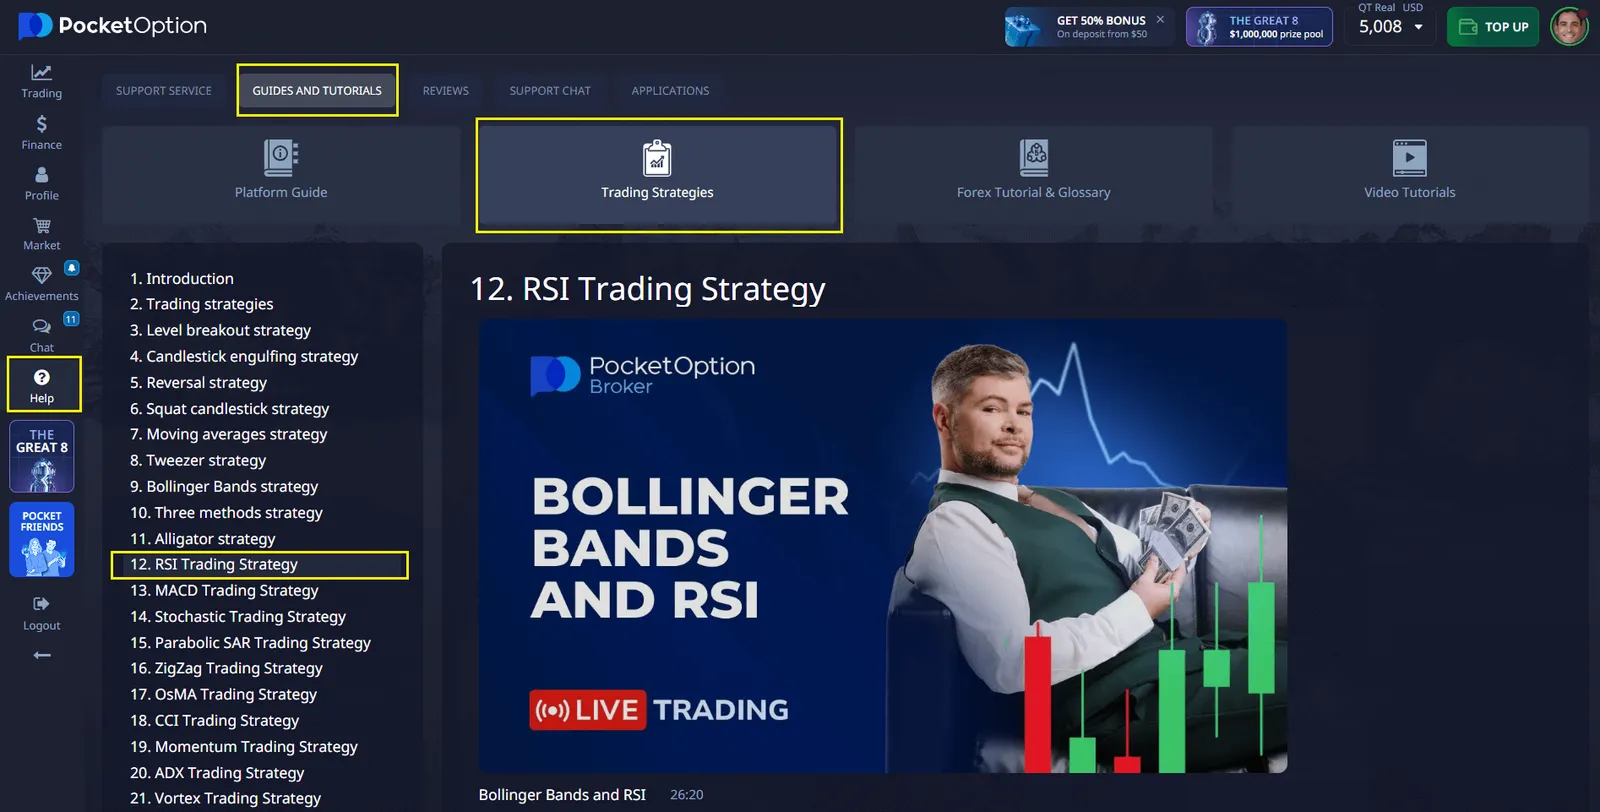
For instance, an RSI value above 70 signals an overbought market, while a value below 30 indicates oversold conditions. However, during strong trends, these thresholds may need adjustment, as markets can remain overbought or oversold for extended periods.
| Indicator | Overbought Level | Oversold Level |
|---|---|---|
| RSI | 70+ | 30- |
| Stochastic | 80+ | 20- |
| CCI | 100+ | -100- |
| Williams %R | -20 to 0 | -80 to -100 |
Volume indicators measure the level of trading activity, helping traders confirm trends and anticipate market movements. Some common volume-based indicators include:
- On-Balance Volume (OBV)
- Volume Profile
- Chaikin Money Flow
In day trading, volume helps confirm the strength of a trend. When price increases but volume decreases, it could indicate potential weakness. Conversely, increasing volume along with price increases typically signals a stronger trend.
| Signal Type | Price Action | Volume | Interpretation |
|---|---|---|---|
| Confirmation | Rising | Rising | Strong bullish signal |
| Divergence | Rising | Falling | Potential reversal down |
| Confirmation | Falling | Rising | Strong bearish signal |
| Divergence | Falling | Falling | Potential reversal up |
Volatility indicators measure the rate and magnitude of price changes. These tools are crucial for managing risk by setting stop-loss levels and adjusting position sizes.
- Bollinger Bands
- Average True Range (ATR)
- Keltner Channels
For example, Bollinger Bands consist of a middle band (usually a 20-period moving average) and upper and lower bands set two standard deviations away. When price approaches or exceeds these bands, it could indicate a reversal point.
| Market Condition | Bollinger Band Pattern | Trading Implication |
|---|---|---|
| Low Volatility | Bands contract (squeeze) | Potential breakout preparation |
| High Volatility | Bands expand | Possible trend continuation |
| Reversal Signal | Price touches/exceeds band | Potential counter-trend |
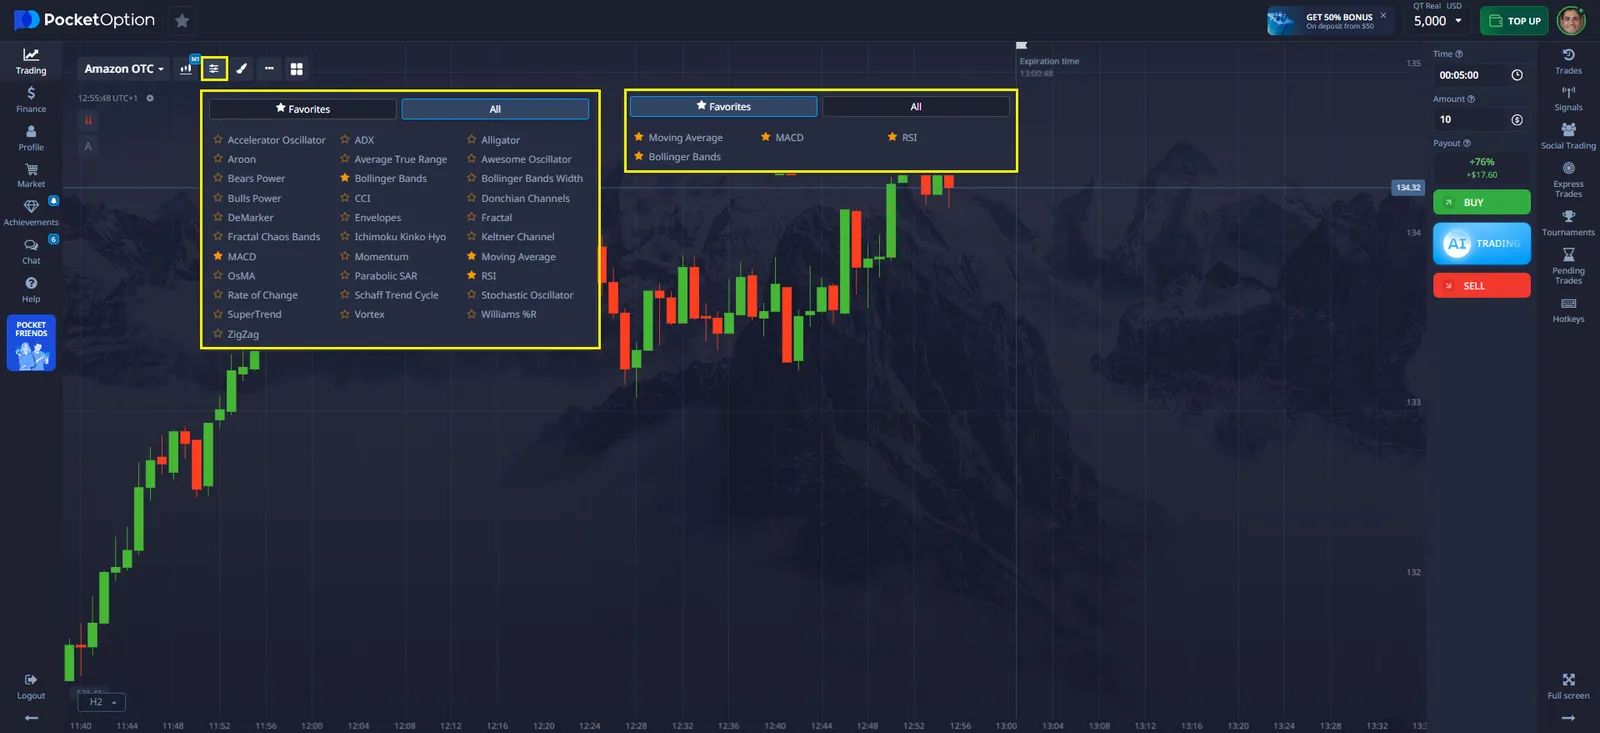
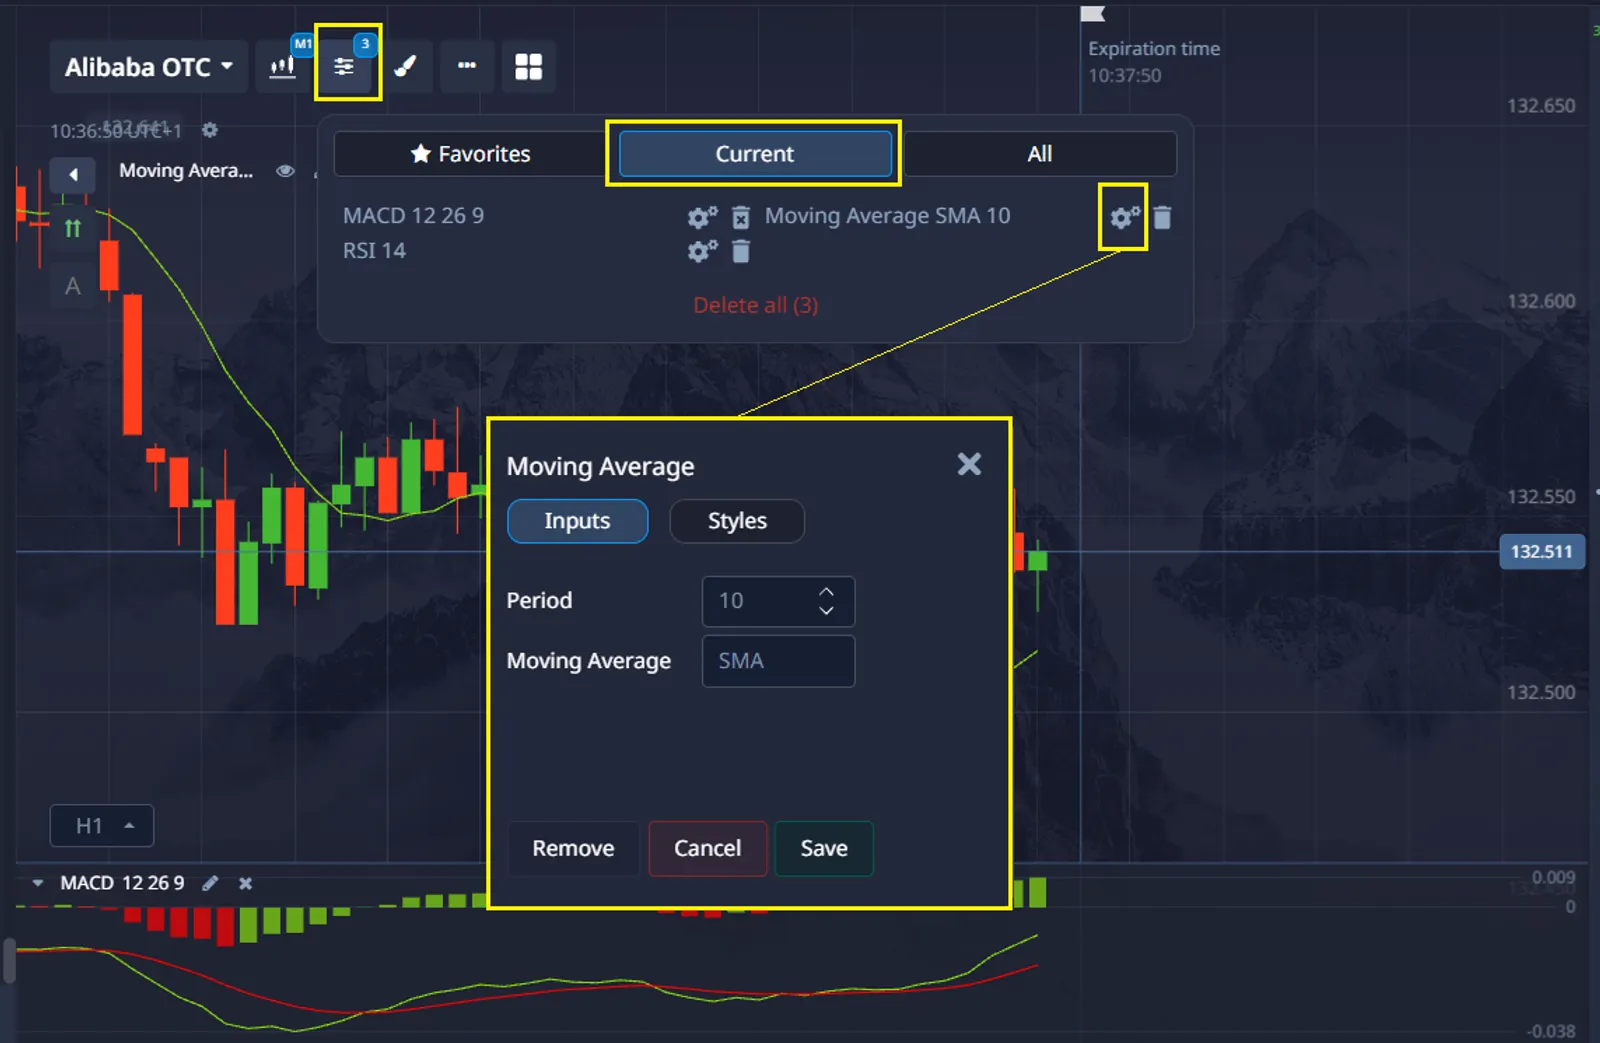
For day trading on the Pocket Option platform, you can select and enable indicators through the "Indicators" section located on the upper left part of the trading interface, near the chart type selector. These tools are mathematically generated and assist in predicting price movements and market trends.
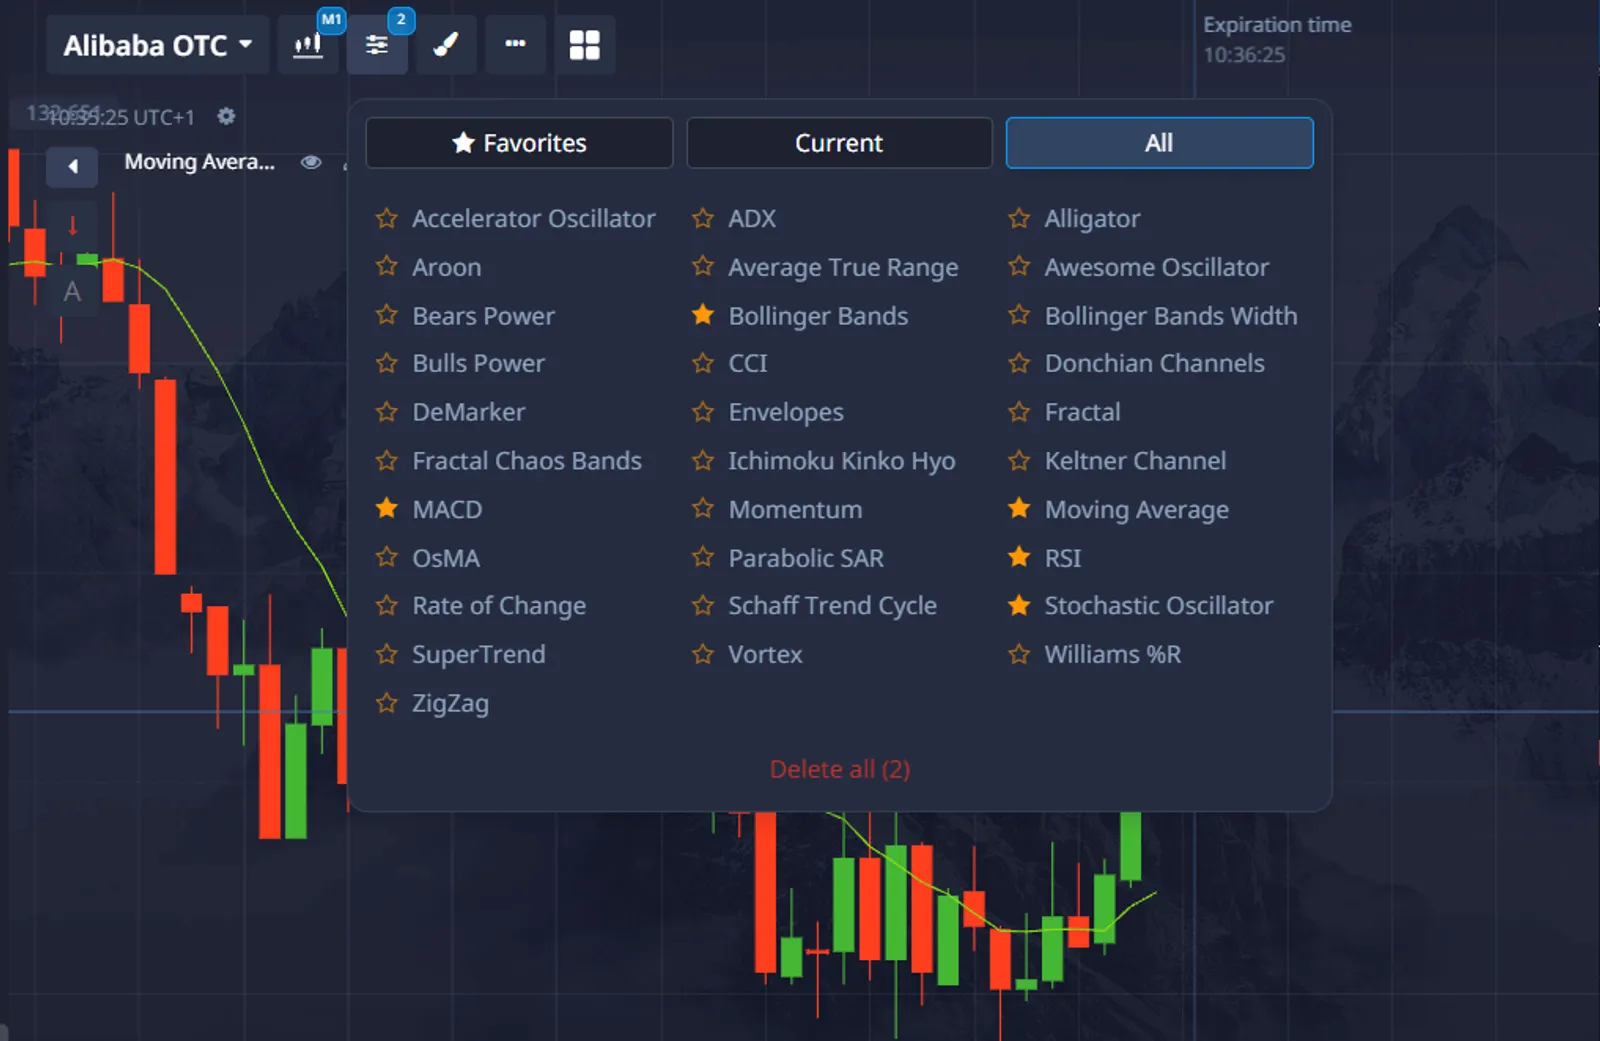
Pocket Option allows traders to add indicators to their Favorites for quick access by simply clicking the star next to them. You can apply up to 30 indicators across all charts, so if you reach this limit, you will need to remove some to add new ones.
📱 Trade on the Go with Pocket Option Mobile App
Ready to trade anywhere, anytime? The Pocket Option mobile app lets you take control of your trades wherever you are!
But that’s not all — you can also access a full range of indicators to make smarter trading decisions on the fly. Quickly adjust your chart, apply your favorite indicators, and execute trades in just a few swipes.
💬 “I’m checking my indicators while waiting for my coffee — and the trade is done in less than a minute.”
💬 “I set up a trade while walking to my car. Super easy — swipe, forecast, and execute!”

The best approach to using indicators in day trading involves combining different types of indicators to confirm signals and minimize the risk of false positives. For example, a trend indicator like a moving average can identify the overall market direction, while momentum indicators help with precise entry and exit timing.
A balanced approach to indicator usage may include:
- 1-2 trend indicators
- 1 momentum oscillator
- 1 volume indicator
- 1 volatility measure
This combination provides a comprehensive market view without overwhelming the trader with redundant information.
Selecting the right indicators for day trading is a matter of understanding how each one works and how they complement each other. Traders on platforms like Pocket Option can utilize a variety of technical tools, such as moving averages, RSI, and Bollinger Bands, to enhance their analysis and improve their trading outcomes. By customizing your setup and leveraging the mobile app, you can stay connected to the market no matter where you are.
Remember, no single indicator is foolproof, and technical analysis should always be paired with solid risk management strategies. Combine the best indicators for your trading style, and you'll be well on your way to smarter day trading.
FAQ
Which indicators work best for beginners in day trading?
For beginners, simple moving averages (20-day and 50-day), RSI, and volume are good starting points. These provide basic trend and momentum information without overwhelming new traders. Once comfortable with these basics, traders can add more specialized indicators to their analysis.
How many indicators should I use simultaneously for day trading?
Most experienced day traders use 3-5 complementary indicators to avoid information overload and conflicting signals. The focus should be on combining different types of indicators (trend, momentum, volume) rather than using multiple indicators that provide similar information.
Can indicators predict market reversals accurately?
No indicator can predict reversals with 100% accuracy. Indicators are best used as probability tools that suggest potential reversals. Divergences between price action and indicator readings often provide early warning signs, but confirmation is always recommended before trading.
How do I adjust indicators for different market conditions?
During volatile markets, you might want to adjust indicator settings - for example, widening RSI overbought/oversold thresholds from 70/30 to 80/20. In trending markets, moving average periods might be shortened to increase responsiveness. Regular backtresting helps determine optimal settings for current conditions.
Are the same indicators effective across all financial markets?
While most technical indicators work across different markets, their effectiveness can vary. Volume indicators tend to be more reliable in highly liquid markets like major forex pairs or large-cap stocks. Some specialized indicators are designed for specific markets - for instance, certain commodity-focused indicators that account for seasonal patterns.