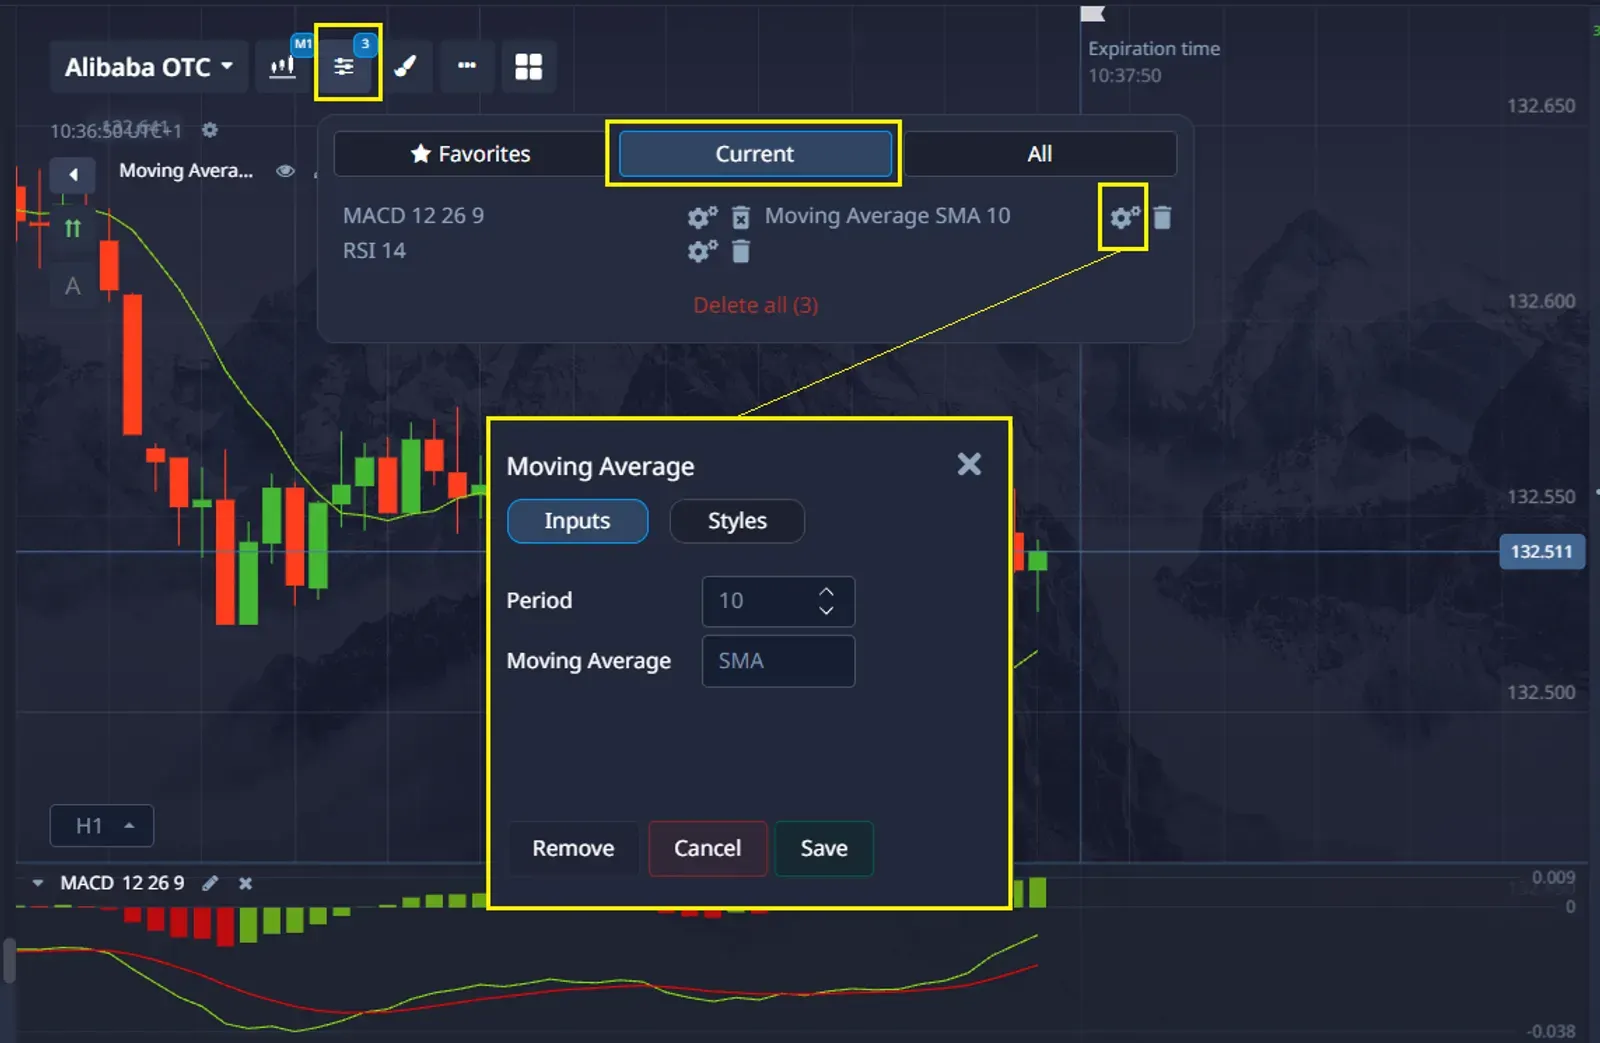
- Moving Averages: Choose a 50-period simple moving average (SMA). This will help you determine the overall trend direction.
- RSI (Relative Strength Index): Set the RSI to a 14-period, which is a standard setting used to measure overbought and oversold conditions.
Option Trading Indicators: The Secret Tools Every Trader Needs
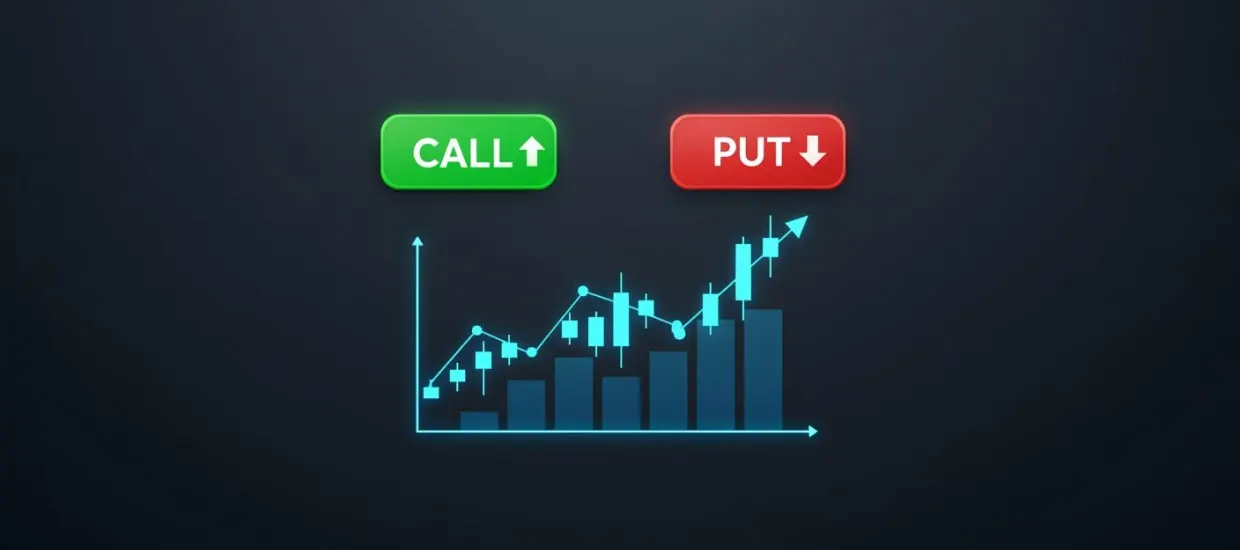
In the fast-paced world of financial markets, option trading indicators aren’t just helpful—they’re essential. Think of them as your trading compass, guiding you through the stormy waters of price movements and helping you make better, more informed decisions. Without them, navigating the markets can feel like sailing blindfolded.
Options trading involves buying and selling contracts that give the right, but not the obligation, to buy or sell an asset at a set price in the future. It allows traders to profit from price movements without owning the underlying asset.
Options trading indicators are like high-tech calculators that use past price and volume data to help predict where the market might go next. These indicators give you signals, such as when to jump into a trade or when to get out. They make the complex world of trading easier to understand by providing clear insights into the market’s direction.
These tools can mean the difference between a successful trade and a missed opportunity. Indicators for options trading help you make sense of all the data flooding your screen. Whether you’re tracking the price movement of an asset, looking for a trend reversal, or assessing risk, indicators are your guiding light.
🚀 Ready to level up your trading? Practice using indicators on Pocket Option for FREE! 🎉 Get $50,000 on your demo account after signing up — no limits, no risk, just pure learning!
📈 Thousands of traders are already on board, and it’s your turn! Join us now!
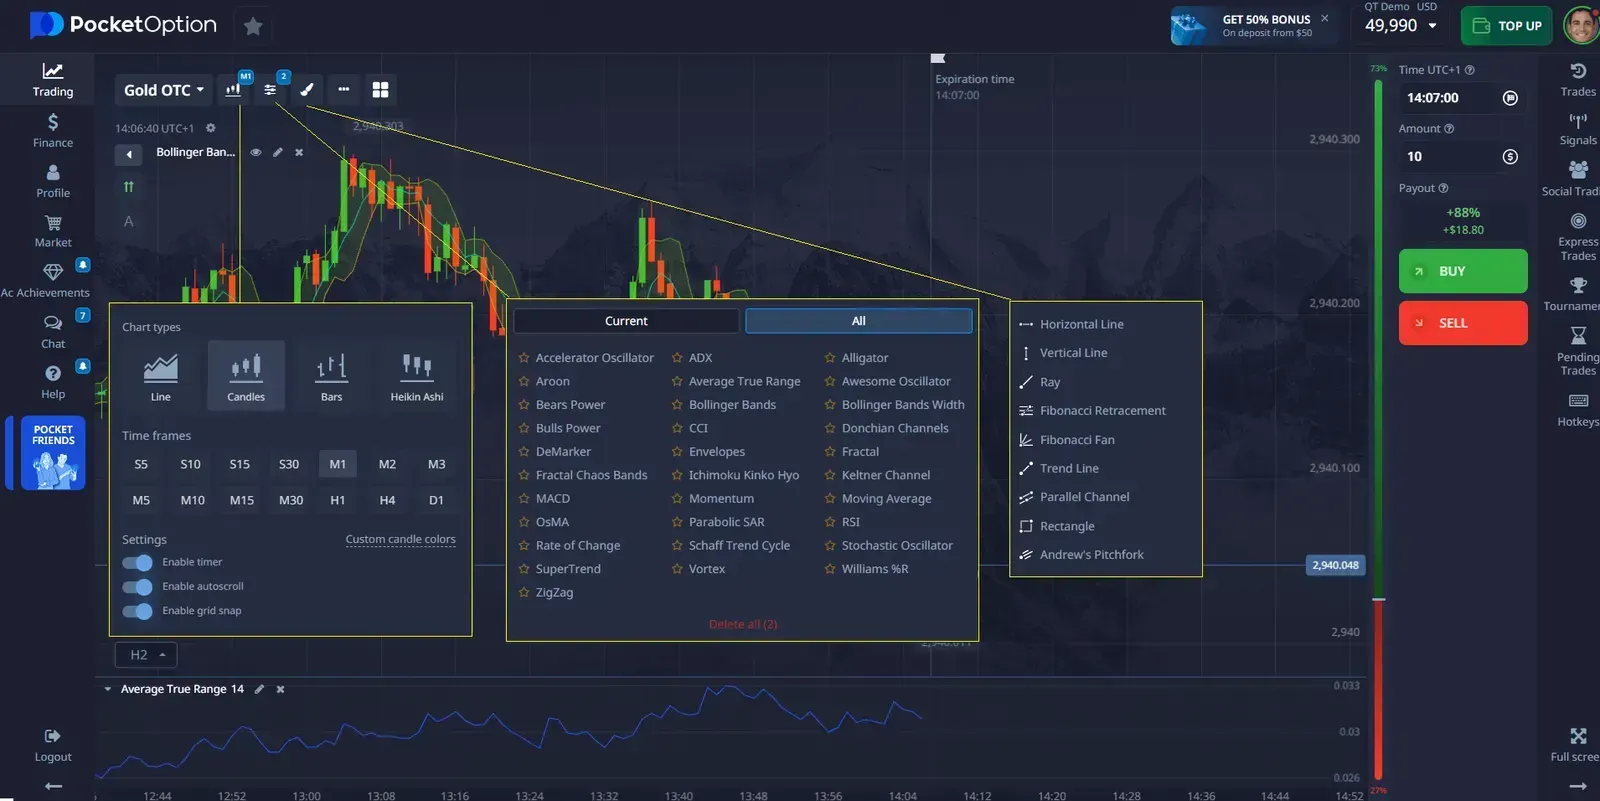
Let’s break down some of the most important types of indicators that traders use every day:
These indicators help you determine which way the market is moving—whether it’s heading up, down, or sideways.
| Indicator | Why It’s Awesome | What It Does |
|---|---|---|
| Moving Averages | Spotting trends early | They smooth out price data to show you where the market’s moving over time. |
| ADX (Average Directional Index) | Finding trend strength | Tells you how strong a trend is, helping you decide whether to hop on it. |
| Ichimoku Kinko Hyo | Predicting price direction | A complete system that gives you support, resistance, and trend signals—all in one view. |
Momentum indicators are like speedometers—they show how fast the price is moving. They help you know when an asset might be overbought or oversold, which can signal a reversal.
| Indicator | Why It’s Awesome | What It Does |
|---|---|---|
| RSI (Relative Strength Index) | Catching reversals | Measures the strength of price movements, signaling when an asset is overbought or oversold. |
| Stochastic Oscillator | Predicting trend changes | Gives you early warning signs when a trend is about to reverse. |
| MACD (Moving Average Convergence Divergence) | Spotting trend shifts | Tracks the relationship between two moving averages to spot potential trend reversals. |
Ever wondered how much a price could fluctuate? These indicators give you a sense of how wild the market might get, so you can manage your risk better.
| Indicator | Why It’s Awesome | What It Does |
|---|---|---|
| Bollinger Bands | Measuring market stress | Shows you how far prices are from the moving average, helping you gauge volatility. |
| Average True Range (ATR) | Predicting wild moves | Measures how much an asset moves during a set period—perfect for assessing risk. |
| Keltner Channels | Checking market calm or chaos | Uses volatility to create upper and lower bands, helping you see when the market is getting crazy. |
These indicators are like the market’s heartbeat—they tell you how much activity is happening. If you see a surge in volume, it’s like the market is saying, “Something big is happening!”
| Indicator | Why It’s Awesome | What It Does |
| On-Balance Volume (OBV) | Confirming price movements | Tracks the flow of money into or out of an asset based on trading volume. |
| Accumulation/Distribution (A/D) | Spotting hidden strength | Reveals whether an asset is seeing a surge of buying or selling pressure. |
To help you get started with trading and using indicators for options trading, let’s walk through a simple strategy that combines two popular indicators: Moving Averages and RSI (Relative Strength Index). This basic approach can help you identify good entry and exit points for your trades.
For this strategy, you’ll need to add two indicators to your chart:
- If the price is above the 50-period moving average, it indicates an uptrend.
- If the price is below the 50-period moving average, it indicates a downtrend.
- When the RSI is above 70, the market is considered overbought, which may signal a potential price reversal to the downside.
- When the RSI is below 30, the market is considered oversold, which may signal a potential price reversal to the upside.
- For a Buy (Call) Option: If the price is above the 50-period SMA (indicating an uptrend), and the RSI is below 30 (indicating the asset is oversold), this could be a good time to enter a buy (call) option.
- For a Sell (Put) Option: If the price is below the 50-period SMA (indicating a downtrend), and the RSI is above 70 (indicating the asset is overbought), this could be a good time to enter a sell (put) option.
- Take Profit: Set a profit target based on previous price swings or resistance levels.
- Stop Loss: Place a stop loss just above or below recent price levels to limit potential losses.
Let’s say you’re looking at a 5-minute chart. The price of an asset is currently above the 50-period moving average, indicating an uptrend. At the same time, the RSI shows a value below 30, suggesting that the asset is oversold. Based on this, you decide to enter a buy (call) option, expecting the price to bounce back up.
This simple strategy combines the trend-following power of the Moving Average and the momentum insights from the RSI. By confirming the overall market direction and looking for oversold or overbought conditions, this strategy helps you enter trades with better timing, increasing your chances of success.
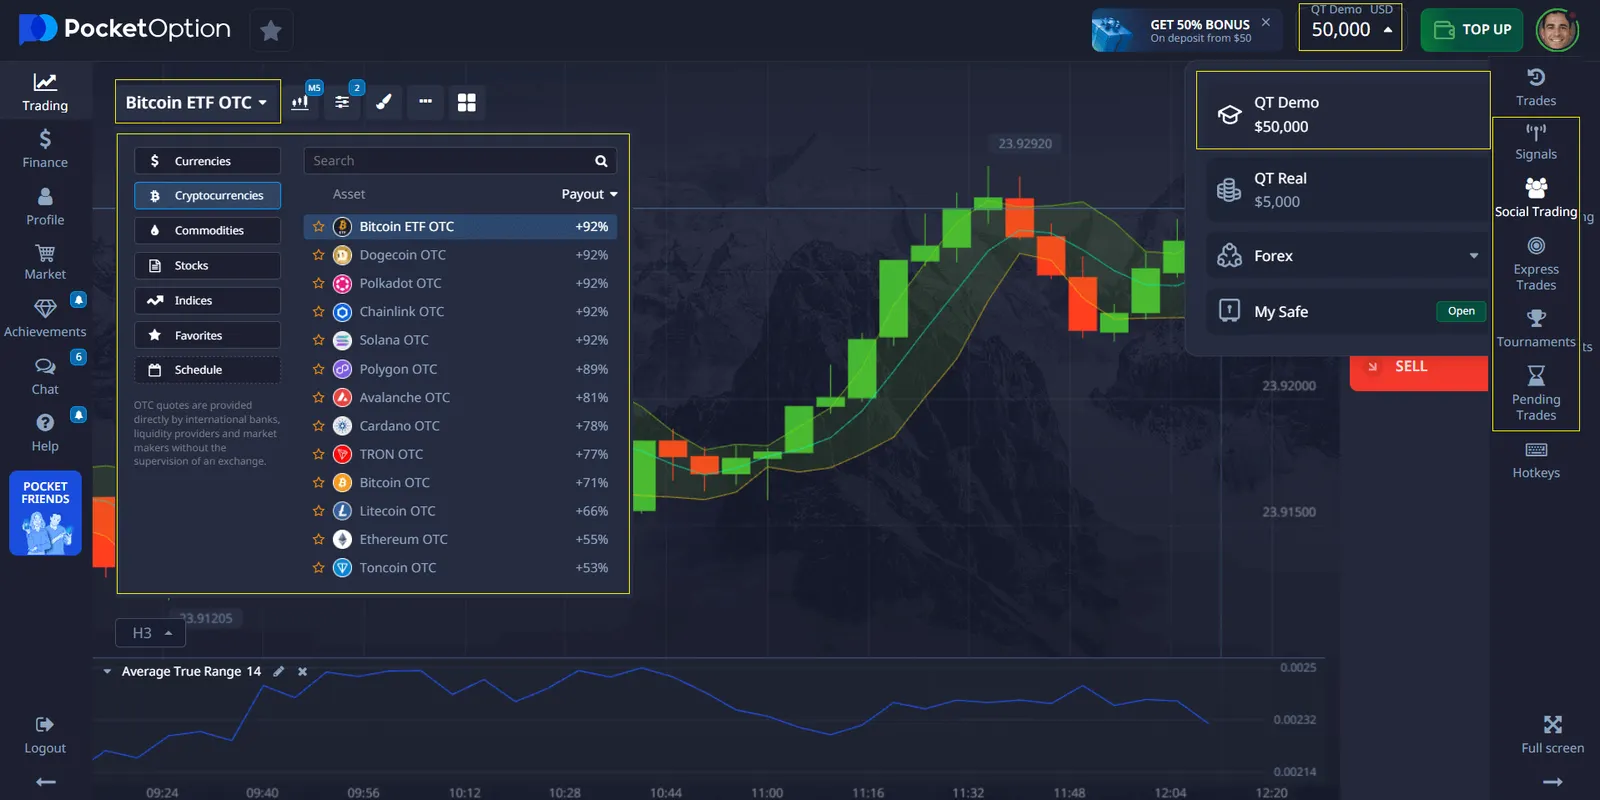
On Pocket Option, the tools at your disposal are far more than just basic indicators. You get access to over 30 powerful indicators that help you take your trading to the next level. Want to predict price movements, spot trends, or manage risks? These tools have you covered.
- 30+ Indicators: From Bollinger Bands to MACD, you can use a wide variety of tools to analyze the market.
- Favorites Feature: Add your most-used indicators to your favorites for super-fast access.
- Customization: Adjust the settings of each indicator to suit your trading strategy.
- Simple Interface: Pocket Option’s user-friendly interface makes it easy to access these indicators without a steep learning curve.
| Indicator Type | What It Can Do for You |
|---|---|
| Trend Indicators | Identify the direction of price movement (e.g., Moving Averages, ADX). |
| Momentum Indicators | Track the speed of price changes (e.g., RSI, MACD, Stochastic Oscillator). |
| Volatility Indicators | Measure price fluctuations (e.g., Bollinger Bands, ATR). |
| Volume Indicators | Confirm price movements based on volume (e.g., OBV, A/D). |
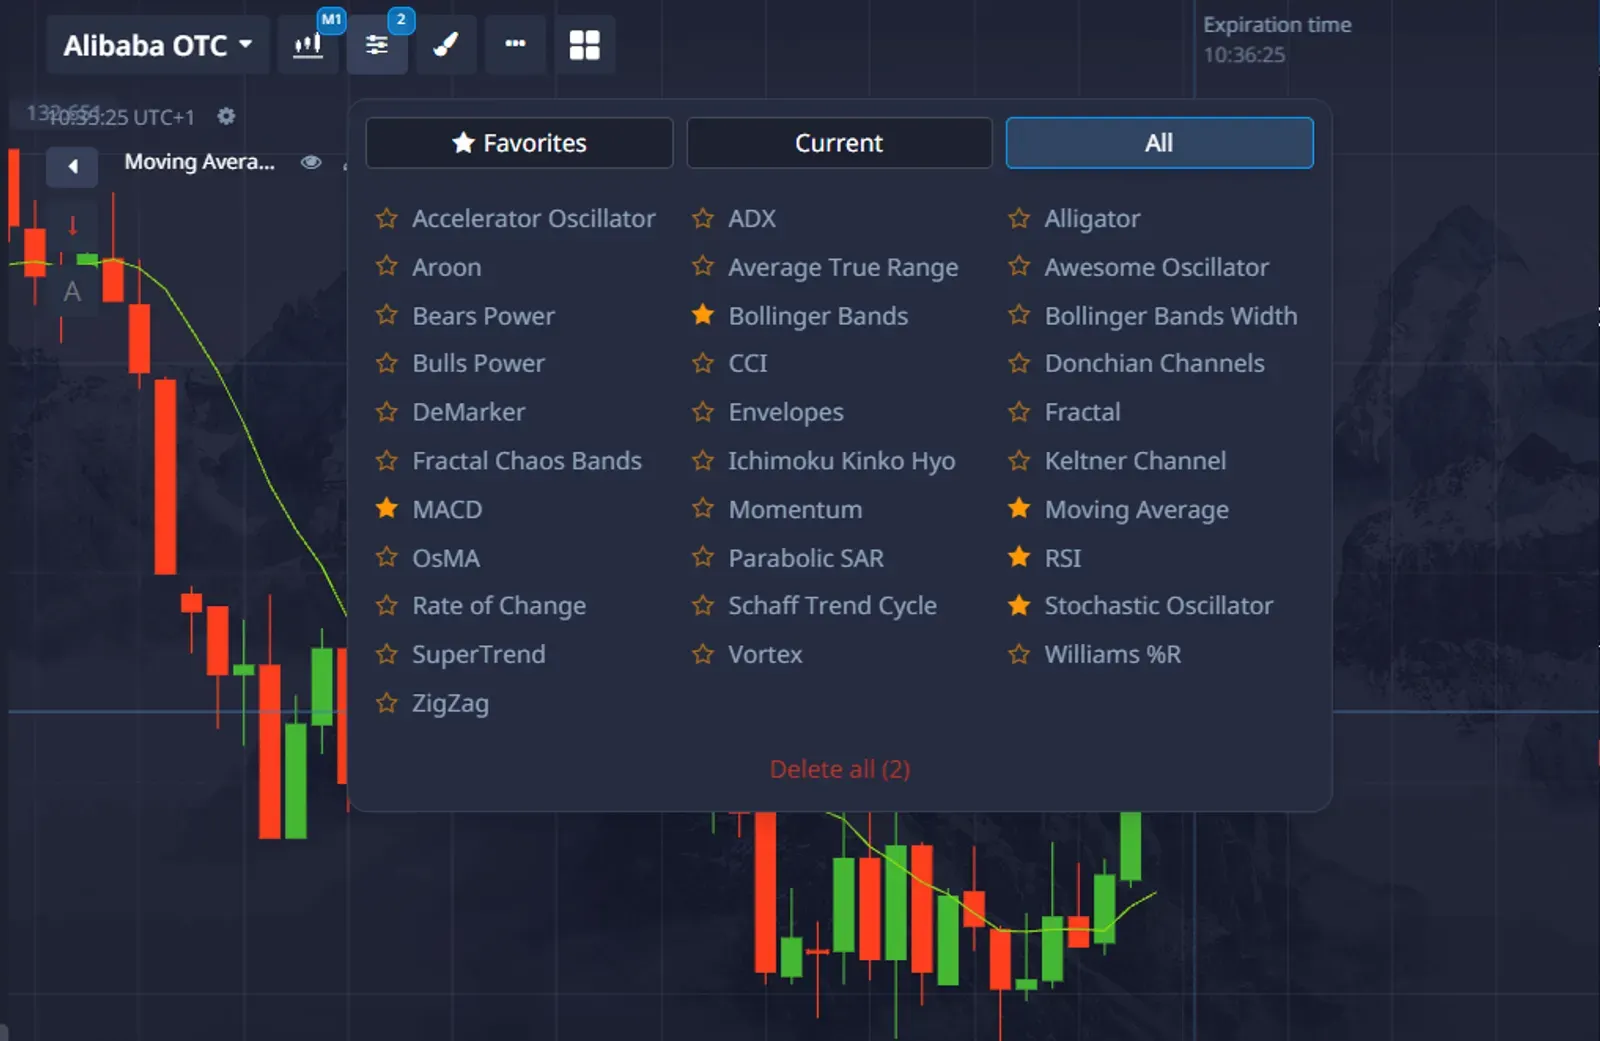
Now that you know how awesome indicators are, here’s how to put them to use:
- Choose Your Indicator: Head to the "Indicators" section in the Pocket Option platform.
- Apply It to Your Chart: Click on the indicator you want and apply it to your chart.
- Personalize Settings: Adjust the indicator’s settings to match your trading style.
- Analyze Market Conditions: Use the indicator to spot trends, momentum, and volatility.
- Trade Smarter: Armed with the insights from these indicators, make more informed trading decisions.
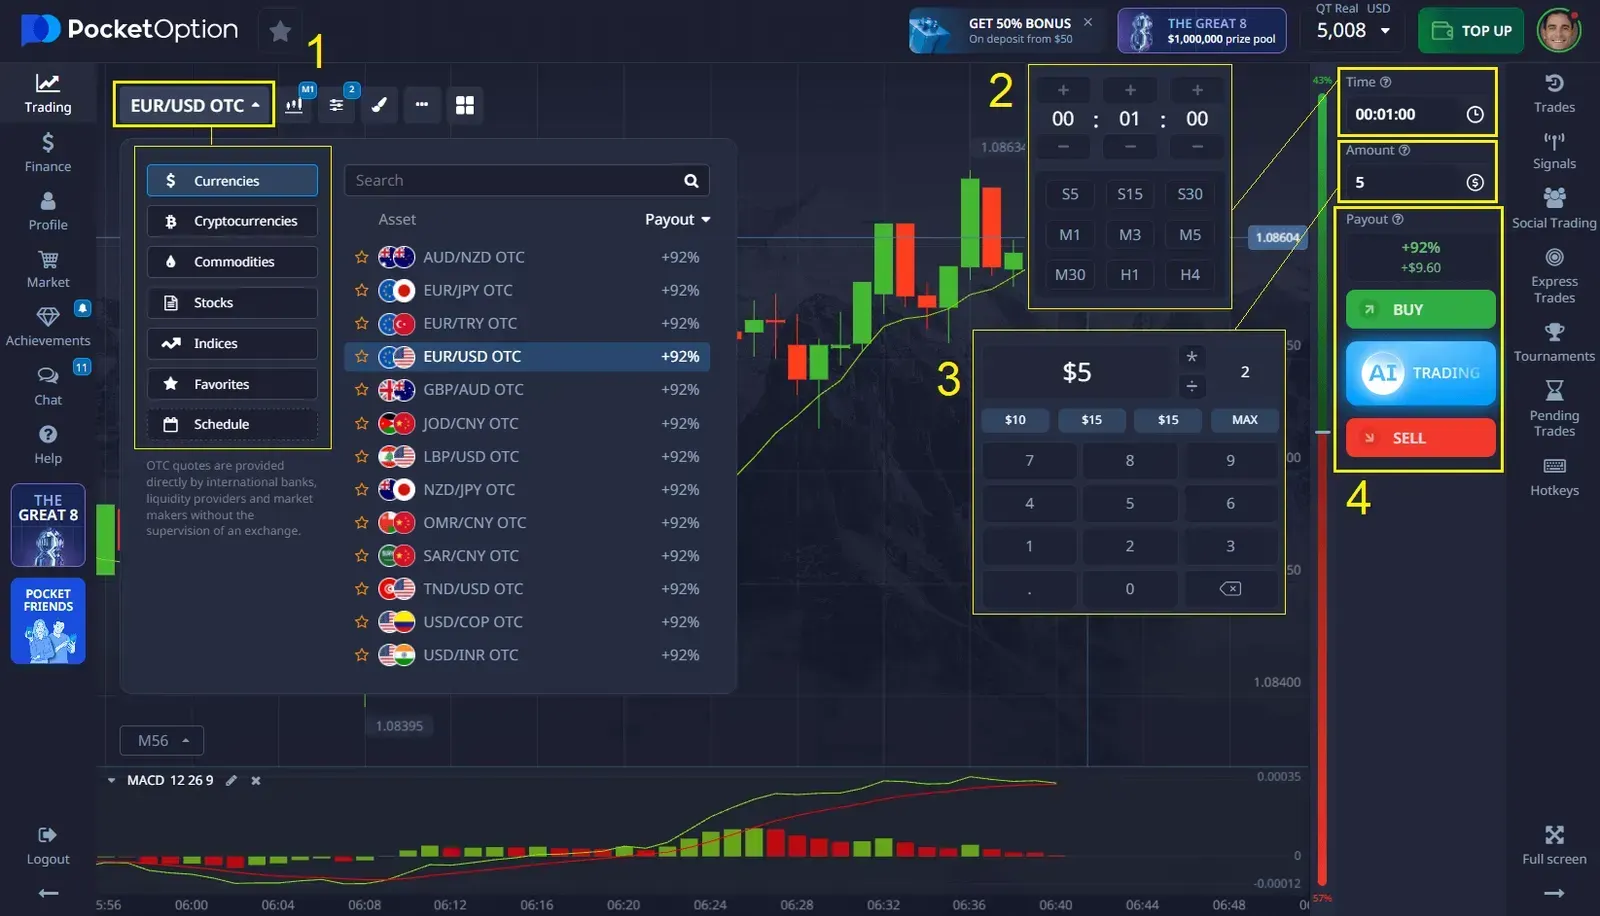
The main feature of Pocket Option is Quick Trading. Here’s where it gets cool: instead of buying or selling assets directly, you simply predict whether the price will rise or fall over a certain period. If you guess right, you could make up to 92% profit. It’s a fast-paced, high-reward way to trade without all the complexities of traditional options.
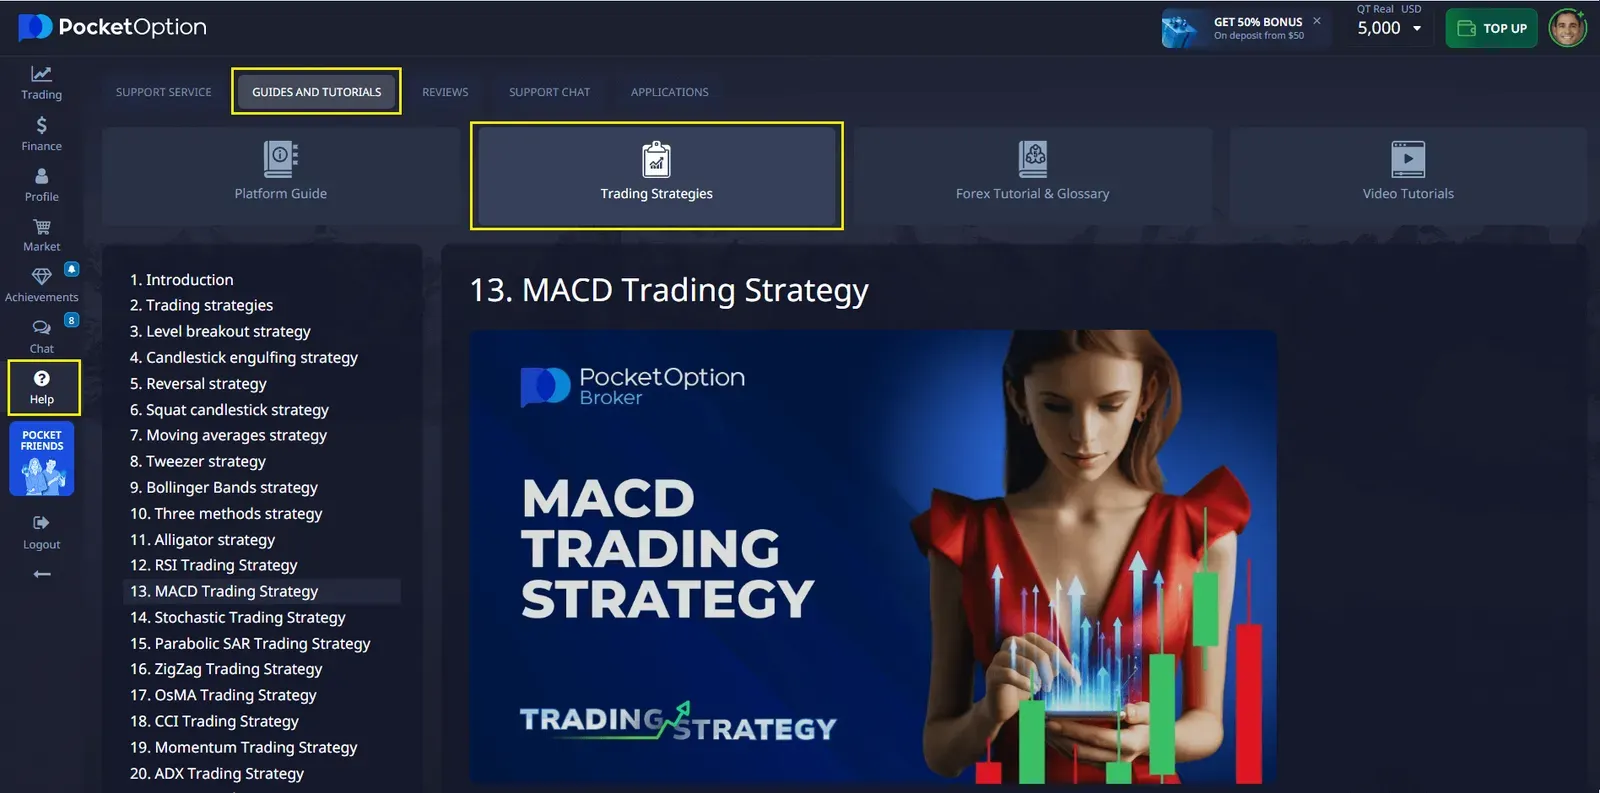
Want to level up your trading? Head over to the Pocket Option platform and check out the Help section. Here, you’ll find Guides and Tutorials that offer both basic and advanced strategies, as well as video instructions on how to use indicators and other essential trading tools.
If you’re always on the go, the Pocket Option mobile app is your best friend. It’s available for both Android and iOS, and it lets you trade on the move with the same powerful indicators and charts as the desktop version.
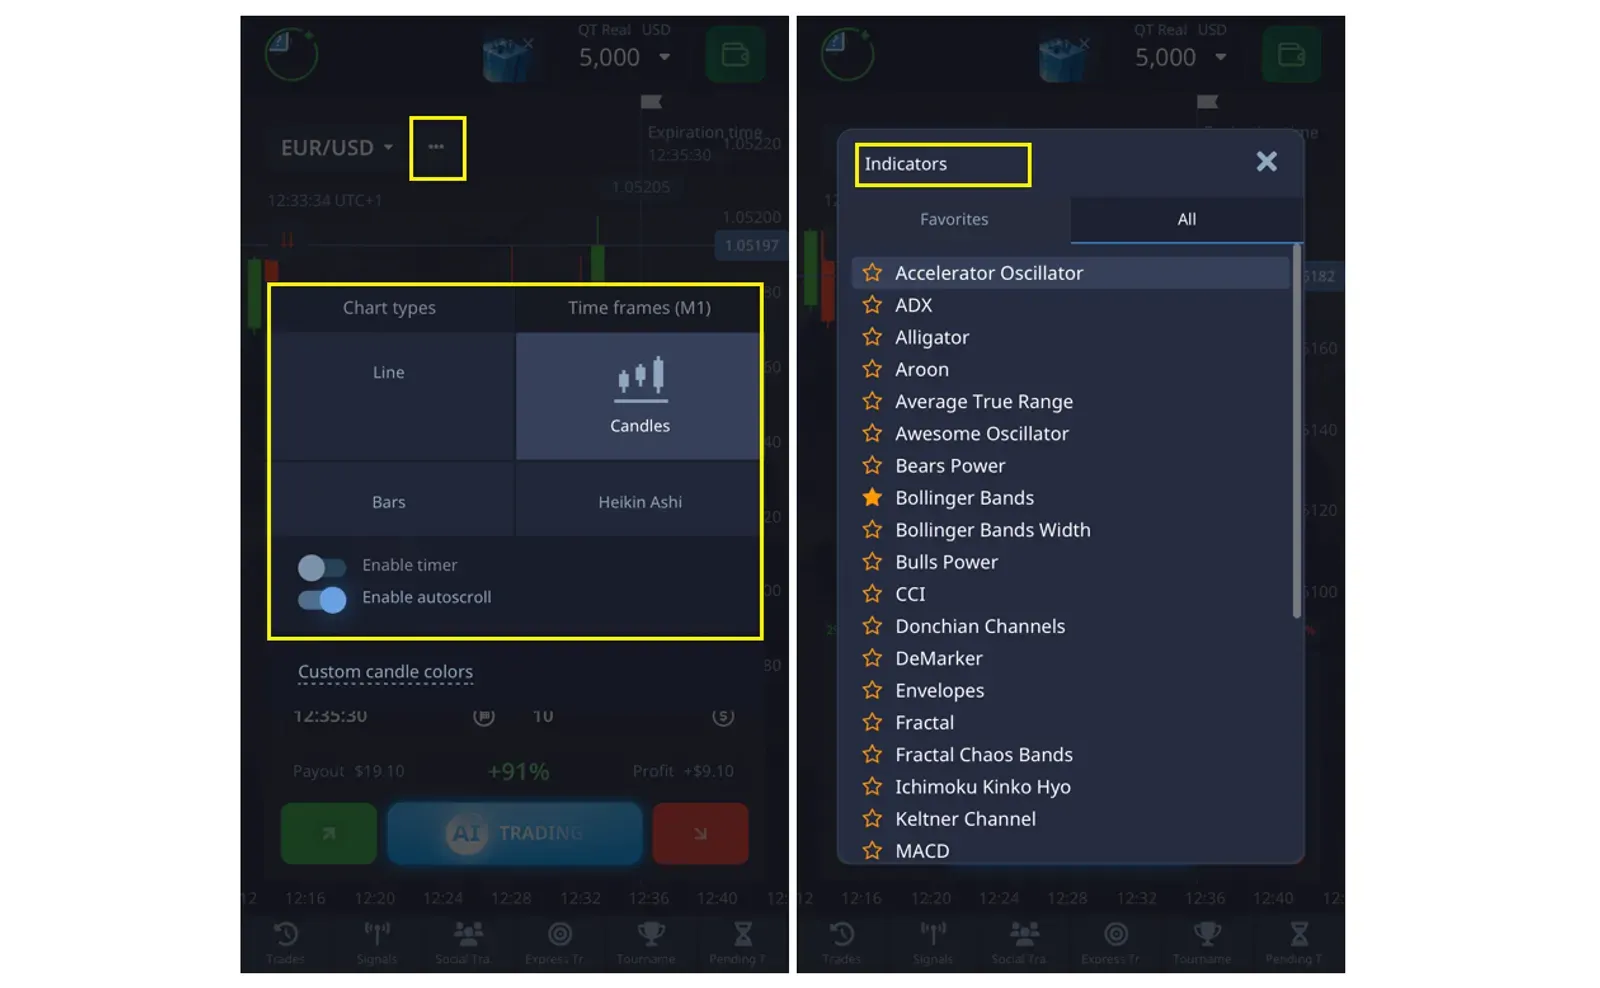
- Download the App: Get it for free on Android or iOS.
- Sign Up: Register for a free account on Pocket Option.
- Start Trading: Use the app to apply indicators and analyze assets wherever you are.
FAQ
What are the most reliable option trading indicators?
The most reliable indicators include Moving Averages, RSI, MACD, and Bollinger Bands, each serving specific analytical purposes in options trading.
How many indicators should I use simultaneously?
It's recommended to use 2-3 complementary indicators to avoid conflicting signals and maintain clear analysis.
Can indicators predict market movements accurately?
Indicators provide probability-based signals rather than absolute predictions. They should be used as part of a comprehensive analysis strategy.
What's the role of volume in options trading indicators?
Volume indicators confirm price movements and help validate trading signals by showing the strength of market participation.
How often should I adjust my indicator settings?
Indicator settings should be reviewed monthly or when market conditions significantly change, but frequent adjustments are not recommended.